YPCCC Hazard Tool
Apr 2026 · Interactive maps
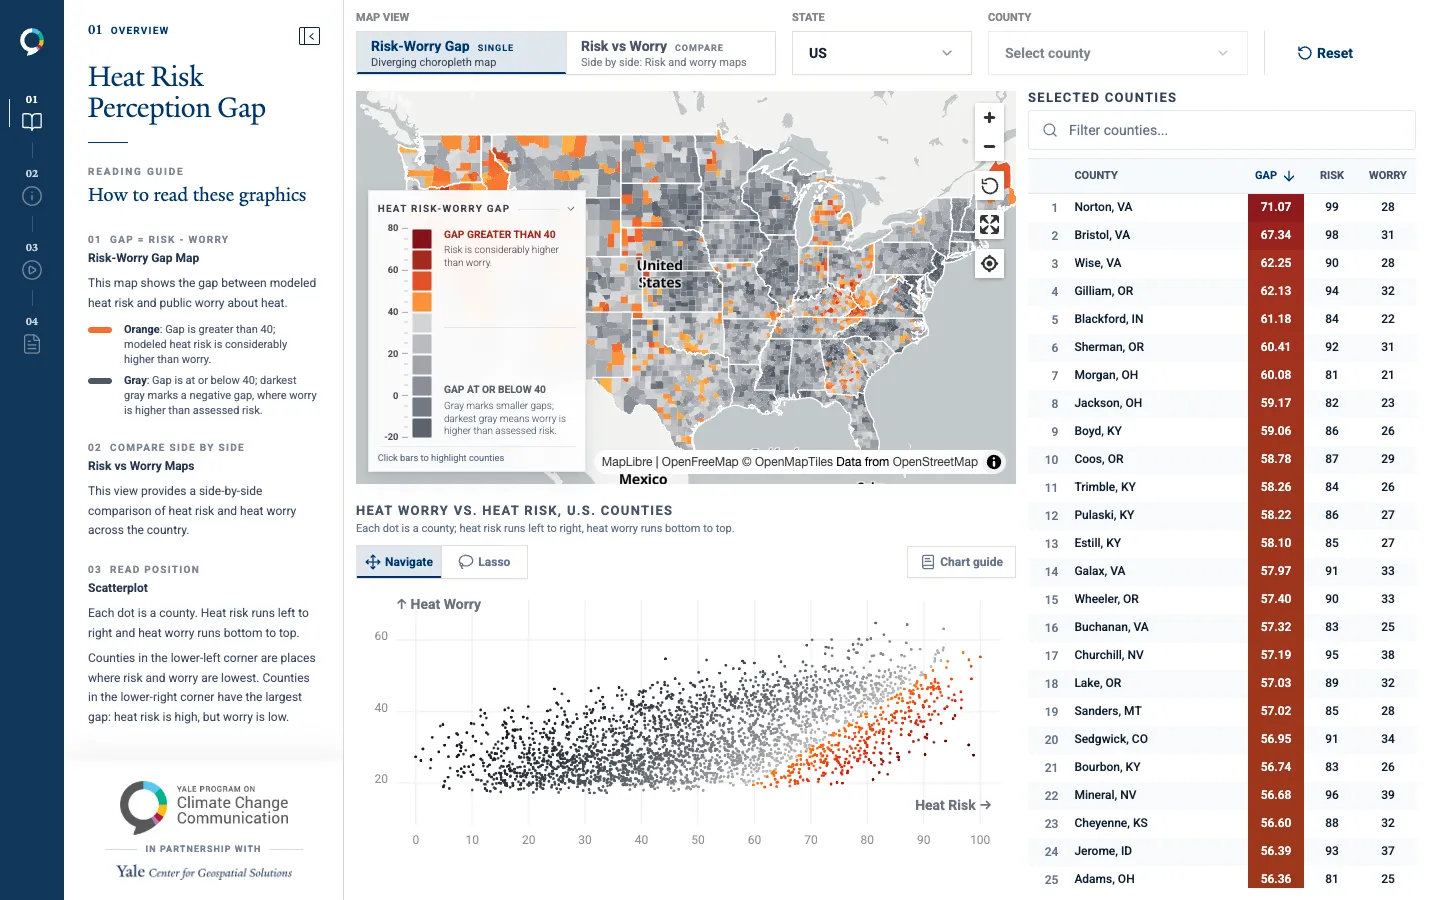
The CDC's Heat and Health Index set against how worried residents are about extreme heat, county by county, to find where the gap is widest. Pick a state, lasso counties on the scatterplot, download the data.
Client: Yale University. Tools: React.js, MapLibre, D3, deck.gl.
Open project